What is Ploty?
How to install it?
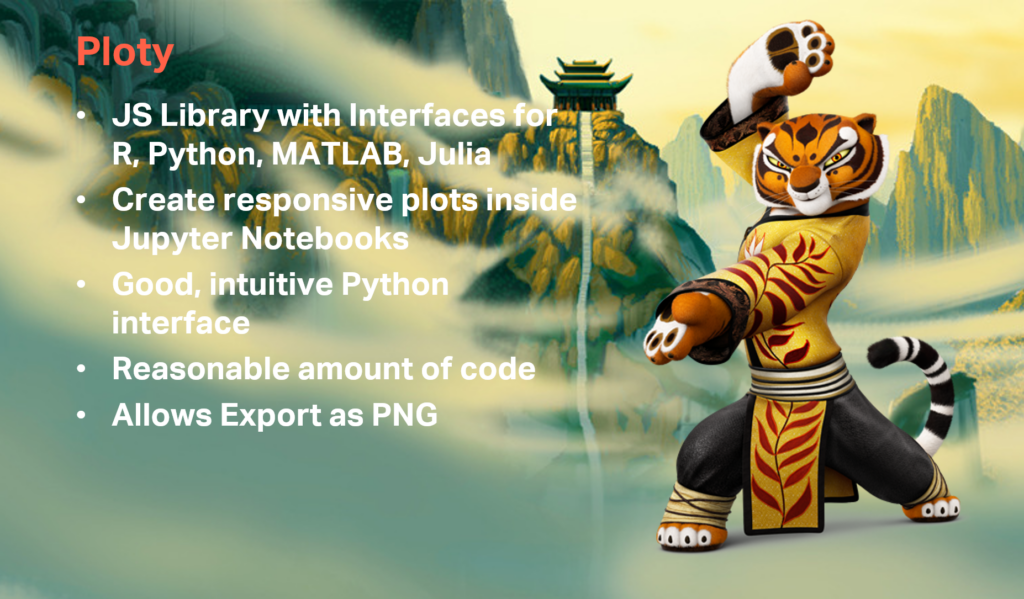
Why using it with TM1 and Planning Analytics
Example: Create a plot chart from a cube view.

What is Ploty?
How to install it?
Why using it with TM1 and Planning Analytics
Example: Create a plot chart from a cube view.