Starting with v6, the open-source version of Elasticsearch is embedded into Pulse. Elasticsearch is a search engine that helps Pulse store all the information about your TM1 application second by second.
This information can then be visualized with the Pulse Explorer. Pulse Explorer is powered by the open-source version of Kibana. Kibana helps you visualize and build your own dashboard on top of the Pulse Elasticsearch data.
Accessing the Pulse Explorer
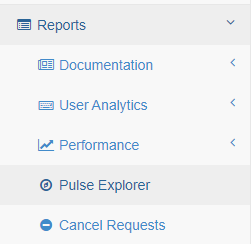
To access Pulse Explorer, first log-in to Pulse with an admin user and then go to Reports > Pulse Explorer:
Kibana will open in a new tab:
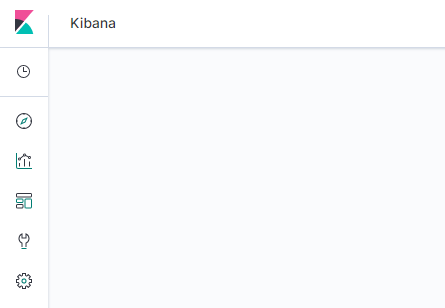
The open-source version of Kibana comes with the following features:

List of recently viewed items

Discover: To explore Pulse Elasticsearch data

Visualize: To create visualization

Dashboard: Group your visualizations together

Dev tools: Access Kibana console for advanced tasks

Administration: Administration tasks such as Import/Export dashboars
The Discover mode
Before building dashboards on top of the Pulse Elasticsearch data, you will need to be familiar with the data structure. The Discover mode is here to help you understand the data.
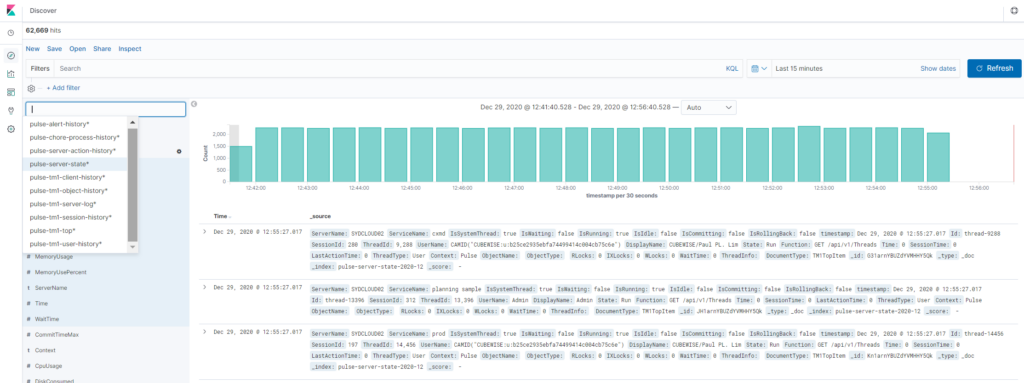
After clicking on the Discover icon, you should be able to see this, just below filder you can change the index:
Indices
Instead of a database, Elasticsearch is using indices. To learn more about Elasticsearch indices, you can read the following article:
MySQL structure vs Elasticsearch:
-
MySQL => Databases => Tables => Columns/Rows
-
Elasticsearch => Indices => Types => Documents with Properties
Pulse Elasticsearch data is structured into 10 indices:
| Name | Description |
|---|---|
| pulse-alert-history | Information about Pulse Alerts |
| pulse-chore-process-history | Chores and processes history execution time |
| pulse-server-action-history | Information about Pulse actions such as stop/start services and disconnect users |
| pulse-server-state | All Server information such as server stats including all active threads |
| pulse-tm1-client-history | Information about the }Clients dimension |
| pulse-tm1-object-history | Information about all TM1 objects |
| pulse-tm1-server-log | Server logs information |
| pulse-tm1-session-history | All Sessions history |
| pulse-tm1-top | Information about all threads |
| pulse-tm1-user-history | User usage tracking (Excel, TM1 Web, Canvas and Pulse) |
Indices split by periods
To easier manage the volume data, the indices are split by periods (daily, monthly, yearly), indices that will contain lots of data are split daily (a new index is created every day) whereas indices that store less information are split monthly or yearly (a new index is created every month or year):
New indices are created daily for:
-
pulse-tm1-top (disabled by default)
-
New indices are created monthly for:
-
pulse-server-state
-
pulse-tm1-server-log
-
New indices are created yearly for:
-
pulse-alert-history
-
pulse-chore-process-history
-
pulse-server-action-history
-
pulse-tm1-object-history
-
pulse-tm1-session-history
-
pulse-tm1-user-history
-
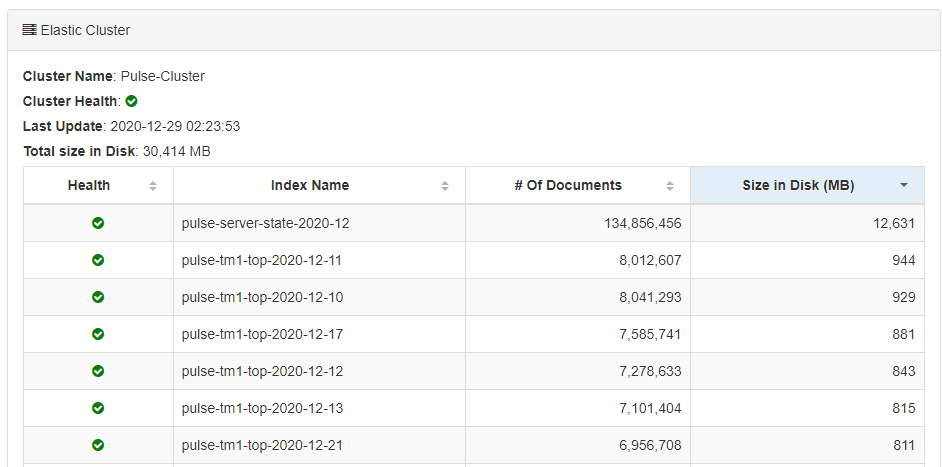
On the Pulse status page, you can see all indices per # of documents and size in the disk. In the example below, we can see there is one pulse-server-state index for 2020-12 (pulse-server-state-2020-12) whereas there are one pulse-tm1-top index per day (pulse-tm1-top-2020-12-11, pulse-tm1-top-2020-12-10…):
The DocumentType property
Some indices such as the pulse-server-state group different types of information such as information about server, instances and TM1top info. Pulse is using the DocumentType properties to group these different type of information.
Once the index selected, adding a DocumentType filter will reduce the fields to the relevant information:
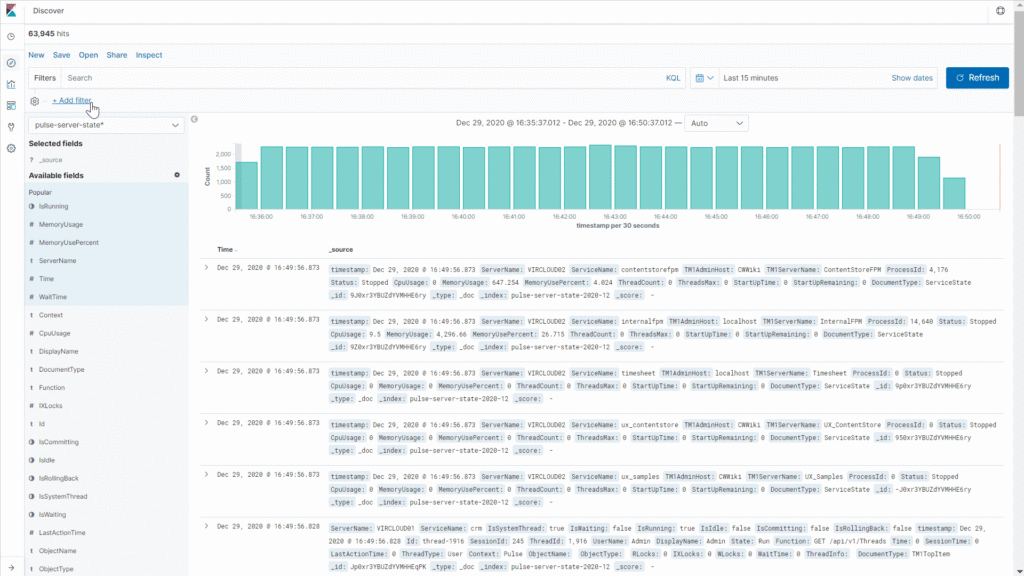
Please find below the list of DocumentType per indices:
| Index Name | Document Type | Description | |
|---|---|---|---|
| pulse-alert-history | AlertLog | info about Pulse alerts | |
| pulse-chore-process-history | choreandprocesshistory | Chore and Process history info | |
| pulse-server-action-history | ServiceControlRequest | info about who started or stopped instances from Pulse | |
| pulse-server-action-history | DisconnectRequest | info about who cancel threads from Pulse | |
| pulse-server-state | Drive | Drive infromation (DriveFreeSpace, DiveSize…) | |
| pulse-server-state | TM1TopItem | Active threads info (DisplayName, Function…) | |
| pulse-server-state | TM1TopState | Active threads status (ThreadsRun, ThreadsWait…) | |
| pulse-server-state | ServerState | Server info (CPU, Memory…) | |
| pulse-server-state | ServiceState | Instance info (StartUpTime, Status…) | |
| pulse-tm1-client-history | Client | TM1 users info (IsAdmin, IsActive…) | |
| pulse-tm1-object-history | Relation | Relation info between objects | |
| pulse-tm1-object-history | CubeStats | Stats by cube (FedCells, PopulatedNumericCells…) | |
| pulse-tm1-object-history | CubeDimension | Dimensions per cube (DimensionName, IndexNumber…) | |
| pulse-tm1-object-history | Process | Process info (PrologLines, DataLines…) | |
| pulse-tm1-object-history | Cube | Cube info (Rules info, Views…) | |
| pulse-tm1-object-history | Dimension | Dimension info (Hierarchies, Subsets…) | |
| pulse-tm1-object-history | DimensionAttribute | Attributes info (Type, CreateDate…) | |
| pulse-tm1-object-history | Application | Application info (Name, Path…) | |
| pulse-tm1-object-history | Chore | Chores info (IsActive, Processes…) | |
| pulse-tm1-server-log | tm1serverlog | Message log info (MessageLevel, MessageText…) | |
| pulse-tm1-session-history | Session | Sessions info (Session time, IsAdmin…) | |
| pulse-tm1-top | TM1TopItem | TM1 Top info (ObjectName, Function…) | |
| pulse-tm1-user-history | PulseLog | What Pulse users are doing | |
| pulse-tm1-user-history | WebLog | What TM1Web users are doing | |
| pulse-tm1-user-history | Workbook | Workbook info (OpenTime, Path, Type…) | |
| pulse-tm1-user-history | CanvasLog | What Canvas user are doing |