-
Building Time Dimensions
Arc v1.9 includes a Time Management plugin to build a Day, Week, ISO Week Month and Year dimensions in just a few clicks.
-
Tips – From financial planning to narrative reporting – the story of TM1 at Allegis Group

Kate Lu shares her experience on how the web interface, Apliqo UX, improved their budgeting process for Allegis Group, using TM1 as the functional database.
-
Tips – TM1Web, Planning Analytics upgrades and other developments at Austrade

Austrade share their experience improving the TM1Web interface by implementing a favourites bar, breadcrumbs, back and forward function and visualisation.
-
Tips – Enhance your report using emoticons in IBM Planning Analytics
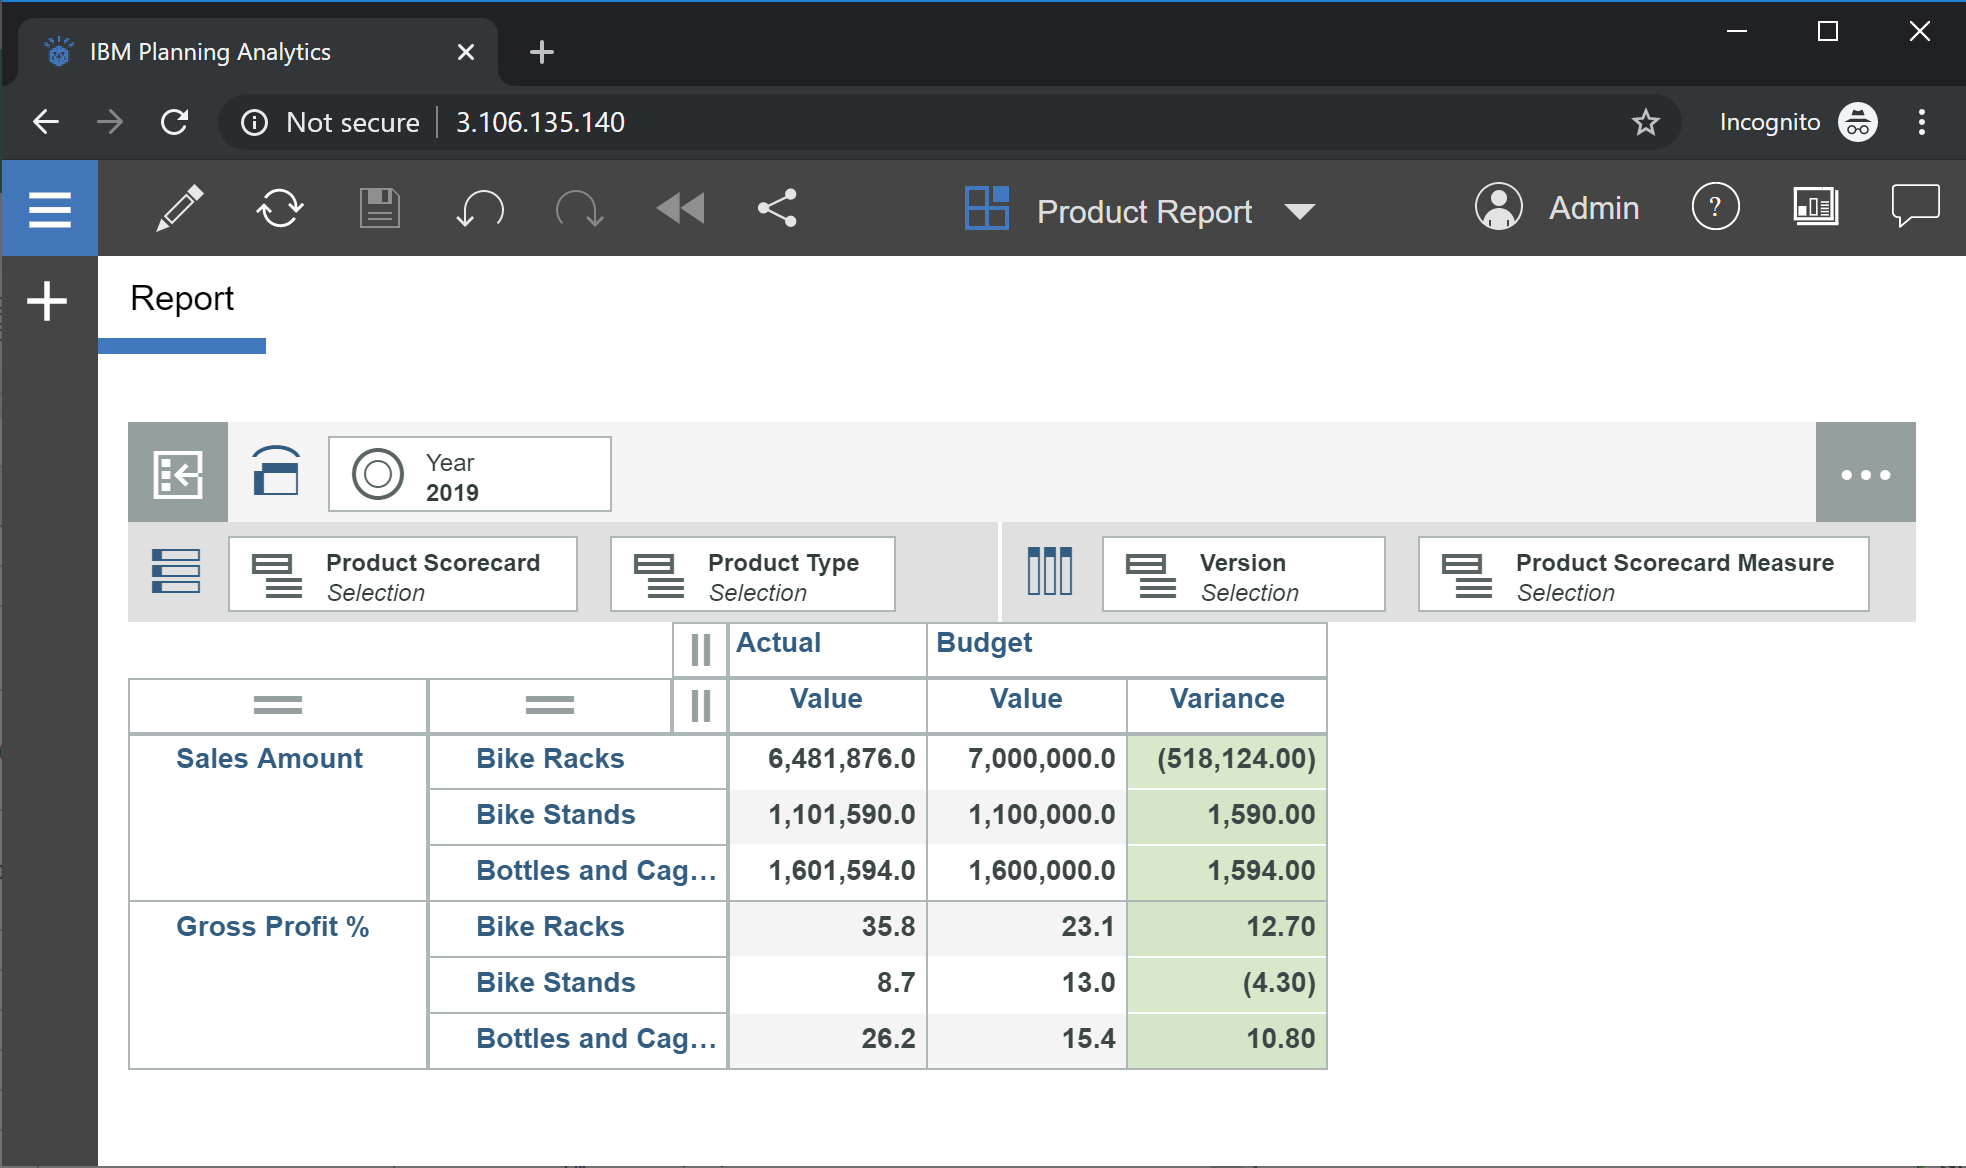
When formatting a report to highlight variances, changing the numerical format to display a negative value with brackets around the number is usually the default method used to highlight differences. Visually, this format isn’t the most effective for users to quickly analyse variances. Add emoticons to your report to enhance its visualisation.
-
Tips – An uneventful upgrade from TM1 9.x to Planning Analytics 2.x

As a result BOQ was able to successfully upgrade to TM1 version 11 (Planning Analytics 2), with minimal change to the business. It was easier than expected.
-
Gaining a competitive advantage with customer reporting using Canvas for TM1

Veolia replaced a sustainability cloud solution that provided reports to their customers with TM1 as the database, while using Canvas as the web interface.
-
Tips – Gaining a competitive advantage with customer reporting, courtesy of TM1

Since its implementation, using TM1 and Canvas, the adoption rate for the Customer Reporting system has increased to 200 active users.
-
Tips – How to email a report using TM1
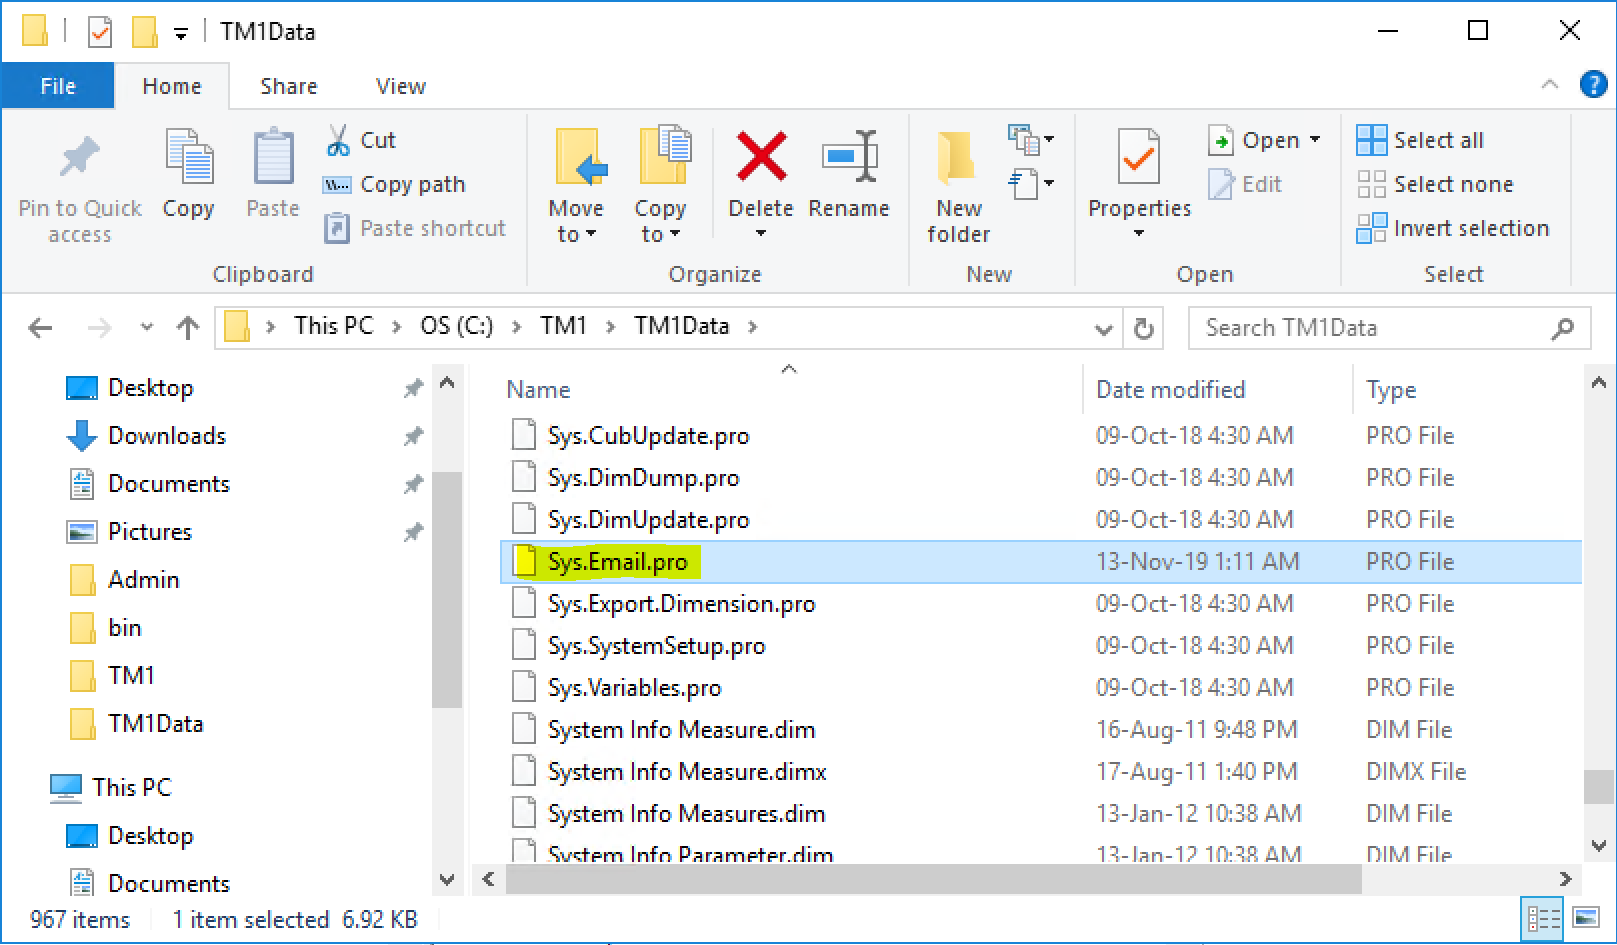
A tutorial on how to email an Excel report using TM1 through a TurboIntegrator (TI) process. Automate reporting capabilities for IBM Planning Analytics.
-
Dark mode for Arc
When using Arc with Google Chrome, it is fairly easy to switch between light and dark mode:
-
Transitioning from Perspectives to IBM Planning Analytics for Excel

5 tips for users transitioning from Perspectives to IBM Planning Analytics for Excel (PAx)