-
Tips – The TM1 Forum interviews Hubert Heijkers in Sydney 2019

-
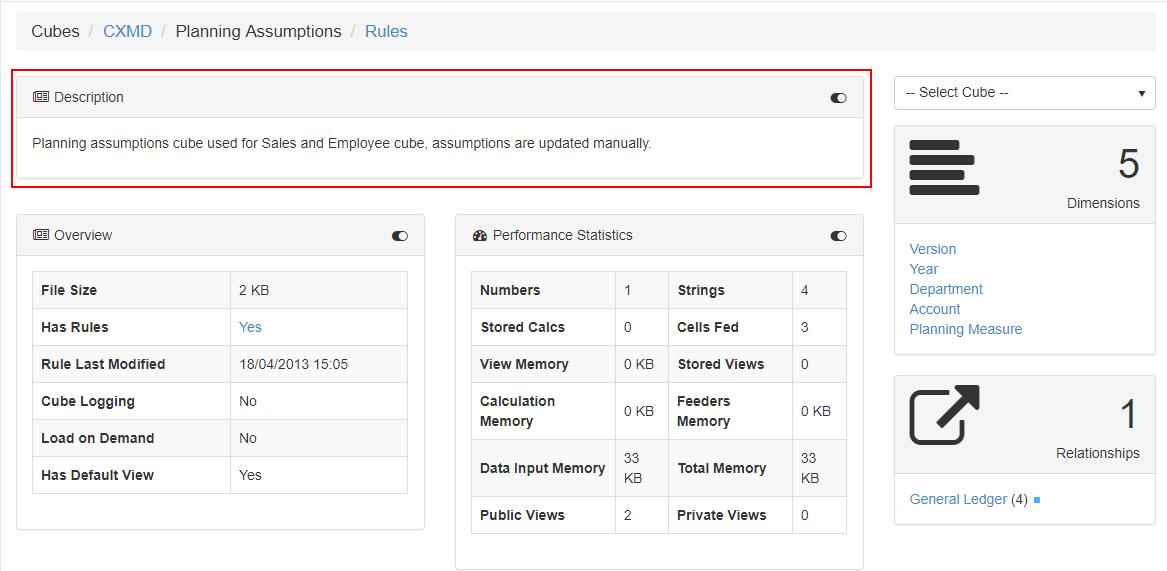
Generating the Technical Documentation
-
Building Time Dimensions
-
Tips – From financial planning to narrative reporting – the story of TM1 at Allegis Group
-
Tips – TM1Web, Planning Analytics upgrades and other developments at Austrade

-
Tips – Enhance your report using emoticons in IBM Planning Analytics
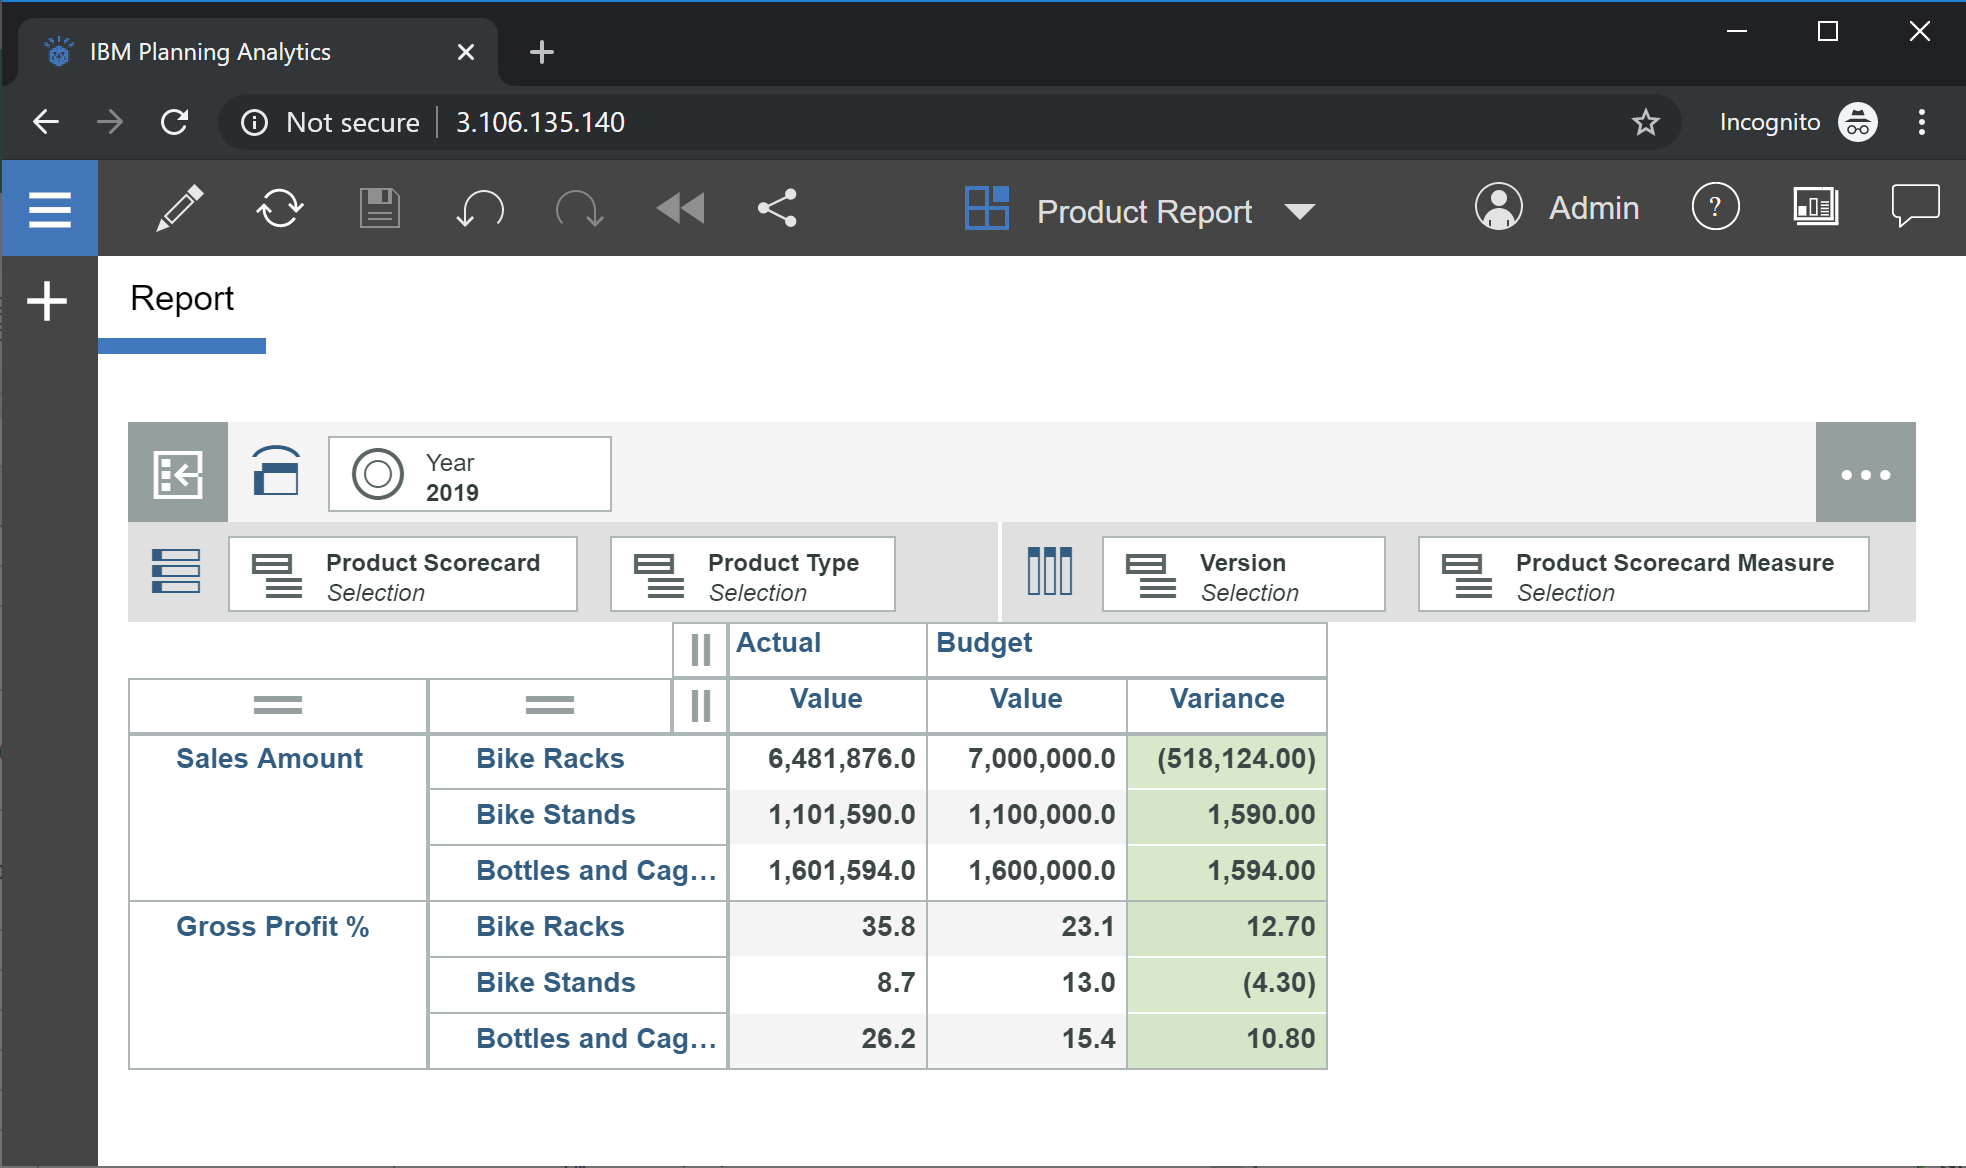
When formatting a report to highlight variances, changing the numerical format to display a negative value with brackets around the number is usually the default method used to highlight differences. Visually, this format isn’t the most effective for users to quickly analyse variances. Add emoticons to your report to enhance its visualisation.
-
Tips – An uneventful upgrade from TM1 9.x to Planning Analytics 2.x

-
Gaining a competitive advantage with customer reporting using Canvas for TM1

-
Tips – Gaining a competitive advantage with customer reporting, courtesy of TM1

-
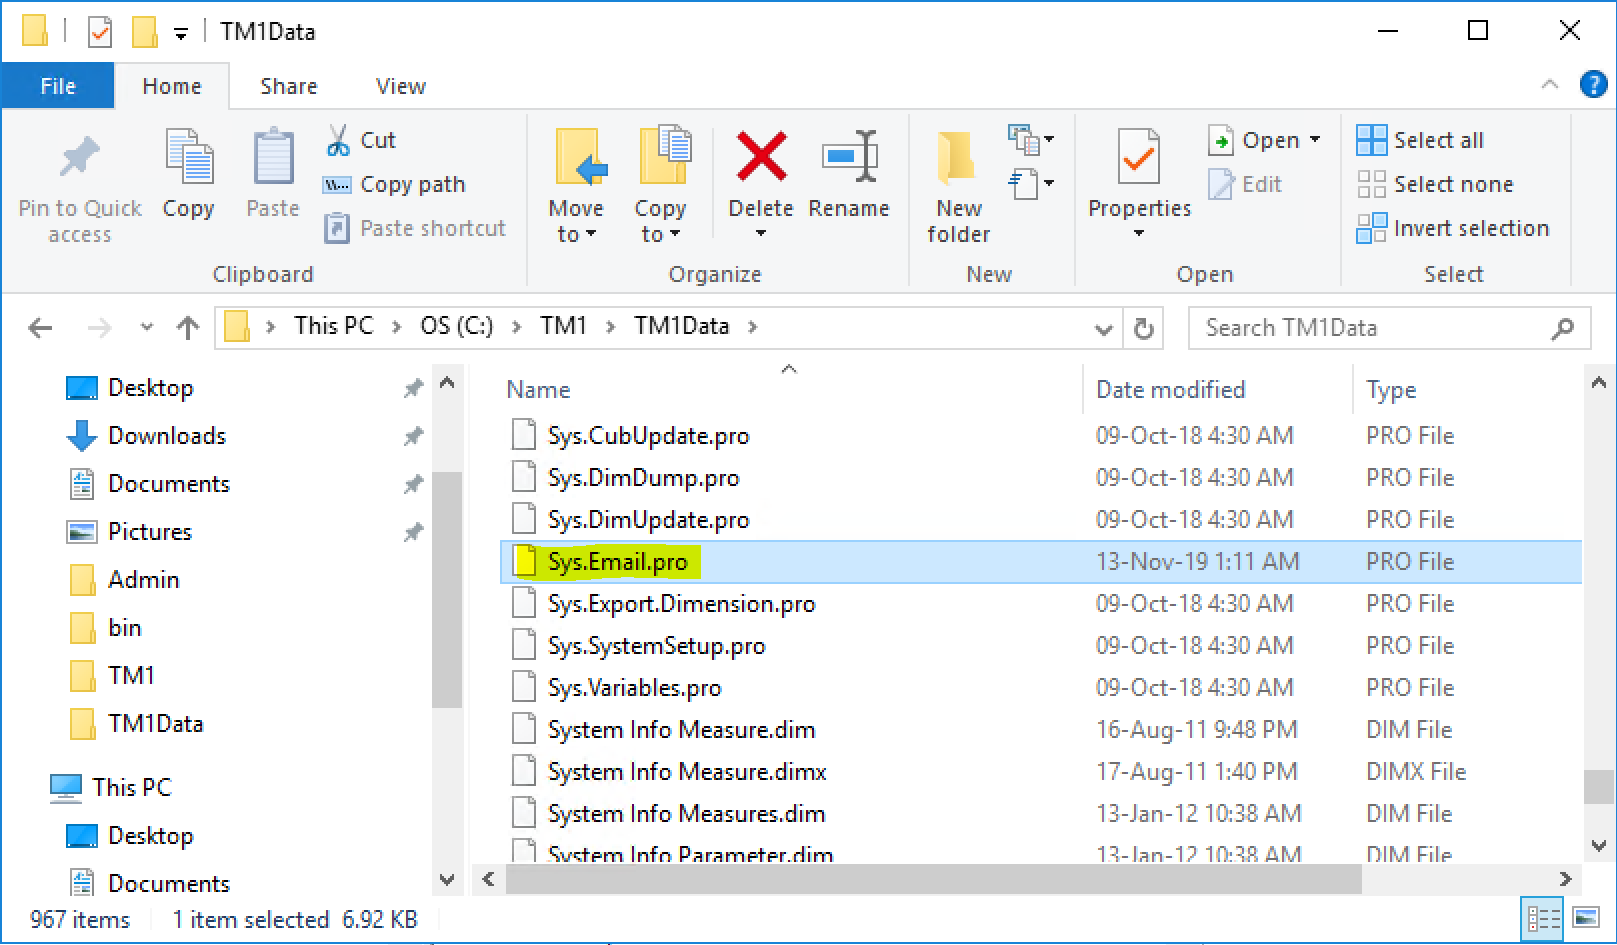
Tips – How to email a report using TM1