-
Tips – A better Data Warehouse with TM1

Optus Business embarked on a project to gain better insight on customer profitability. The technology needed to handle millions of transactions from Data Warehouse, run allocations and reconcile to the financial system.
-
Tips – Alan Kirk discusses artificial intelligence

TM1 legend Alan Kirk from the TM1 Forum exchanges thoughts with Cubewise CODE’s Vincent Viau in a lively conversation about all things TM1, Artificial Intelligence and racing!
-
Tips – Bedrock 4 for TM1, an interview with Adam Davis

Bedrock is library of modular TurboIntegrator (TI) processes built from many years of TM1 Developer expertise to assist developers to build best-practice TM1 and Planning Analytics models.
-
Tips – Artificial intelligence, machine learning and TM1
The subject of using deep learning and predictive forecasting to drive a model where artificial intelligence can be applied to TM1 and Planning analytics.
-
Tips – The benefits of Cubewise CARE for your TM1 and IBM Planning Analytics System

Multi-level support for your TM1 and Planning Analytics system with guaranteed response time, ensure a healthy system, pro-active managed services
-
Tips – The TM1 Forum interviews Hubert Heijkers in Sydney 2019

In a world’s first, TM1 Forum members interview Hubert Heijkers covering hierarchies and the next generation of TM1 and IBM Planning Analytics
-
Tips – From financial planning to narrative reporting – the story of TM1 at Allegis Group
Kate Lu shares her experience on how the web interface, Apliqo UX, improved their budgeting process for Allegis Group, using TM1 as the functional database.
-
Tips – A discussion on innovation with Manny Perez in Sydney 2019
A lot of innovation is about making complex things simple, the product performs well, is scalable and also reliable. Manny discusses the innovation of TM1.
-
Tips – TM1Web, Planning Analytics upgrades and other developments at Austrade
Austrade share their experience improving the TM1Web interface by implementing a favourites bar, breadcrumbs, back and forward function and visualisation.
-
Tips – Enhance your report using emoticons in IBM Planning Analytics
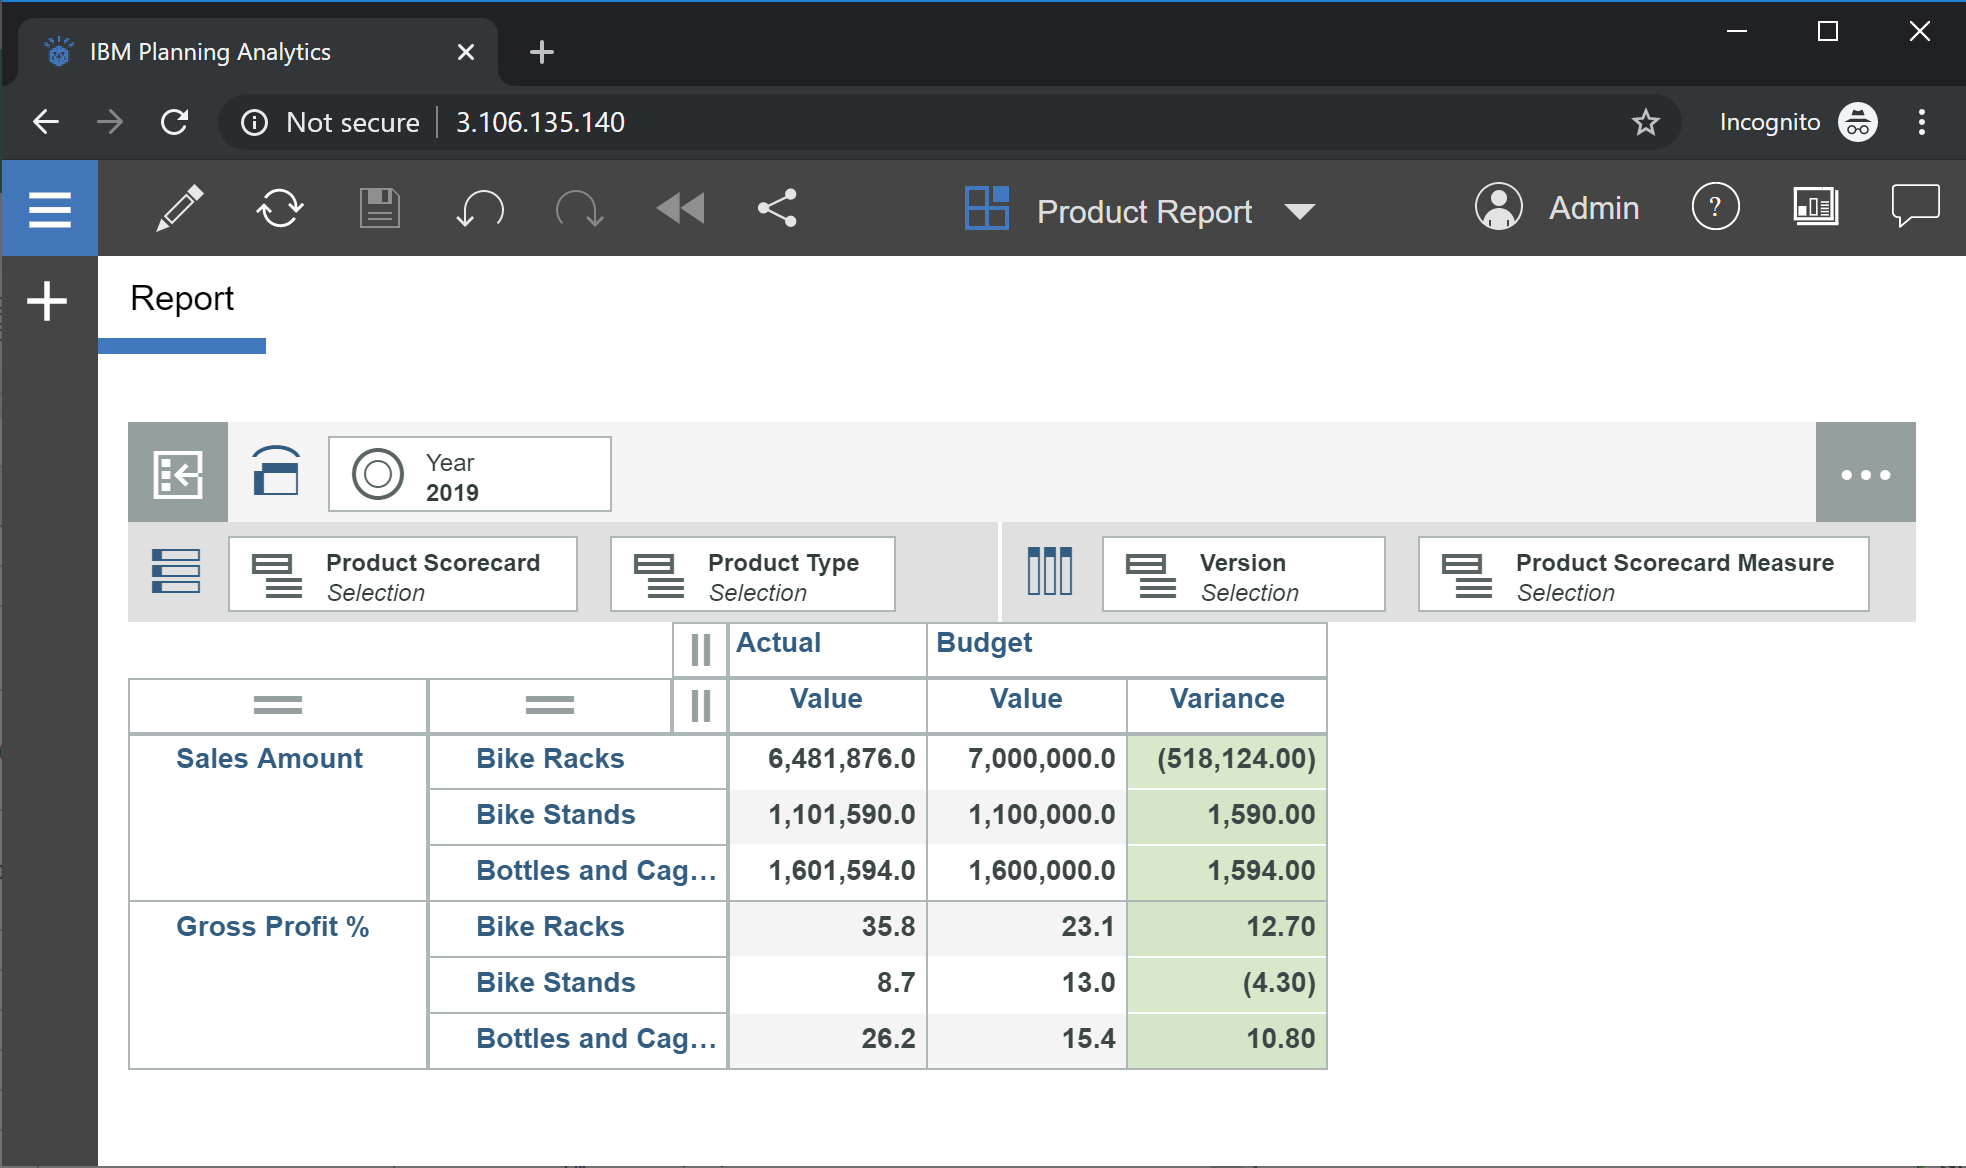
When formatting a report to highlight variances, changing the numerical format to display a negative value with brackets around the number is usually the default method used to highlight differences. Visually, this format isn’t the most effective for users to quickly analyse variances. Add emoticons to your report to enhance its visualisation.