-
Who is using Pulse
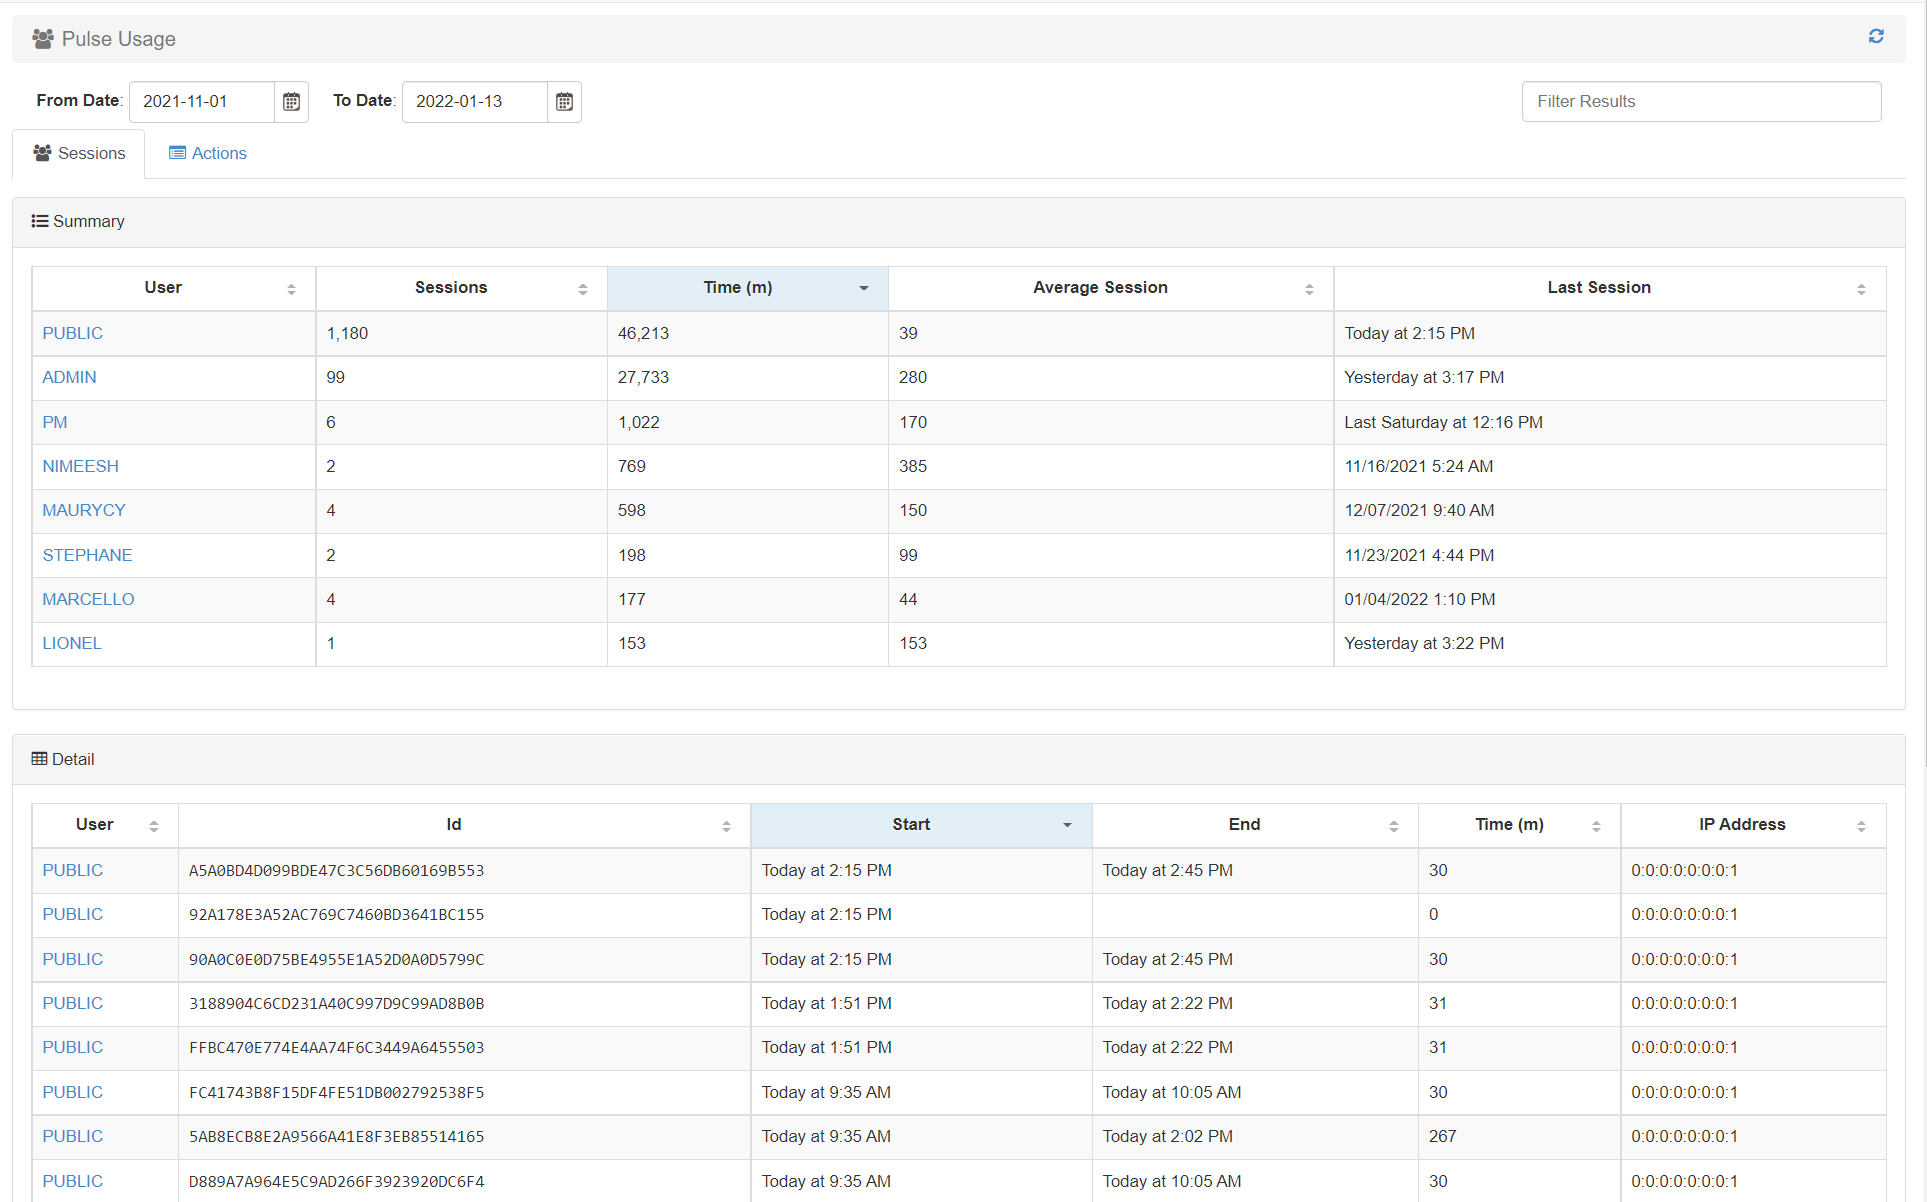
Pulse tracks its own usage. You can see who was logged in and which features they were using.
-
Creating a new Pulse alert
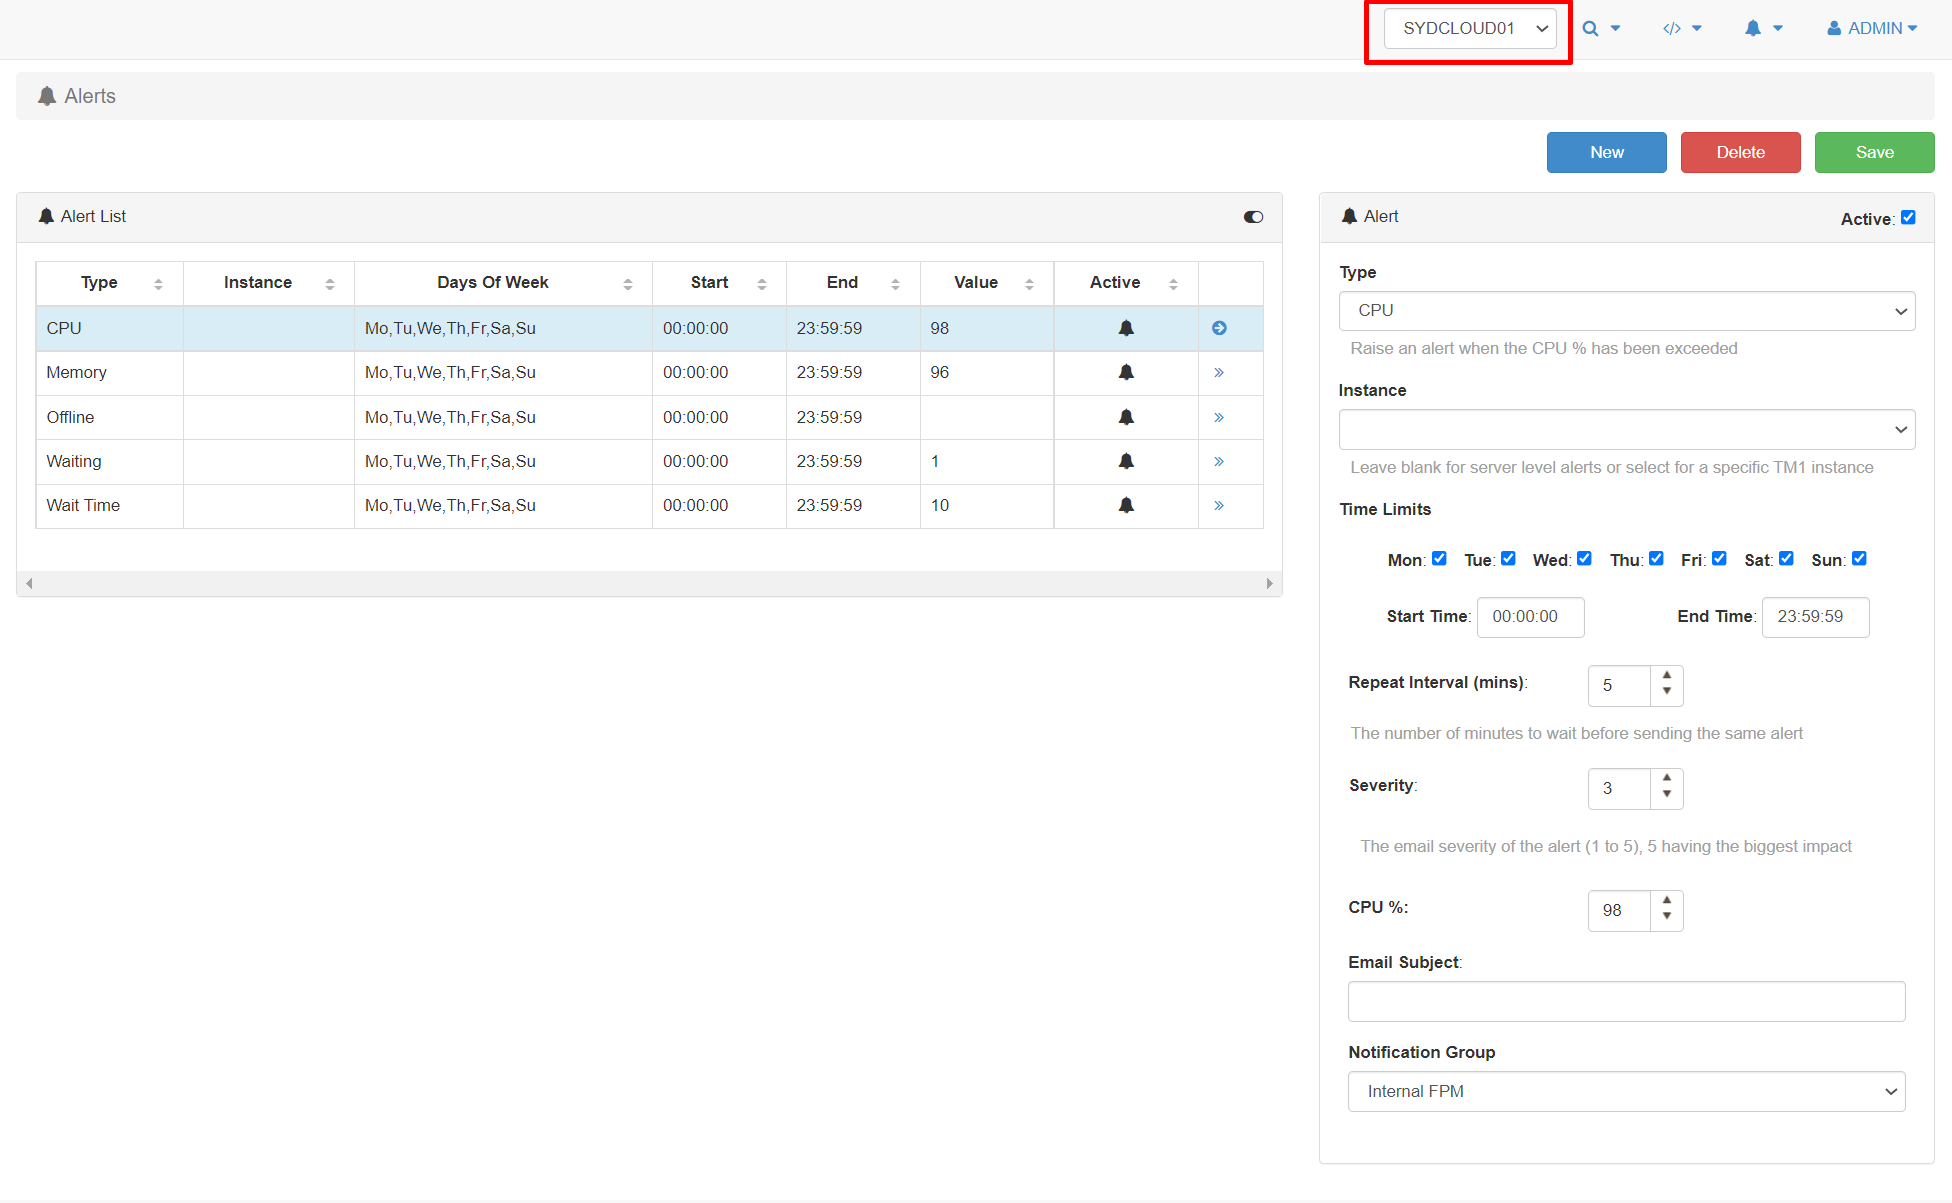
Pro-active Alerts can be configured based on multiple scenarios and triggers. Allowing you to rectify problems BEFORE they become an issue. Alert types include memory use, free disk space, wait time, TM1 crashes, error logs, message logs, run time, etc.
-
Pulse Dashboard Editor
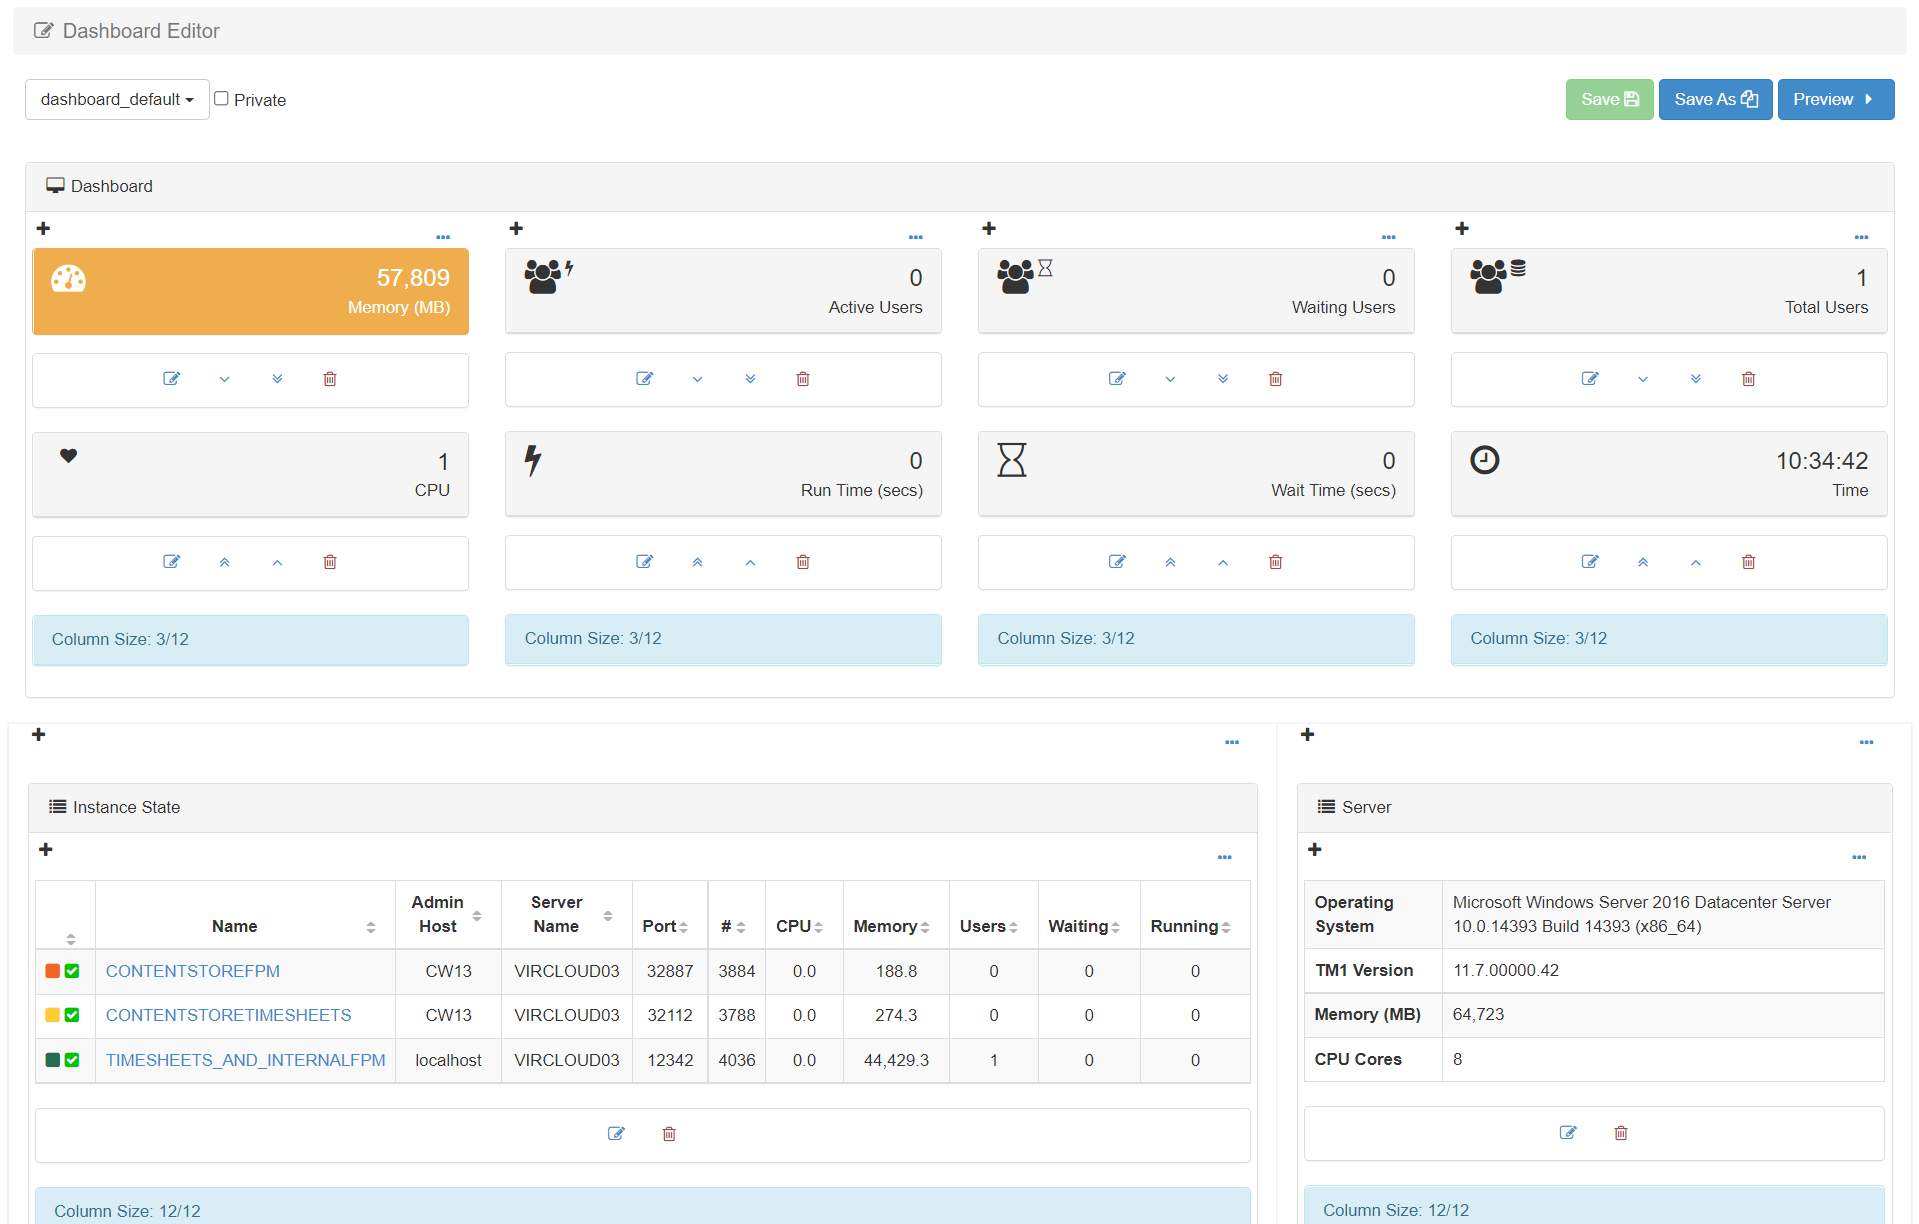
The Dashboard Editor enables you to edit the default Pulse dashboard. For example, you could change the KPIs at the top or show all TM1 instances instead of just the one from the selected server.
-
Pulse Instance Settings
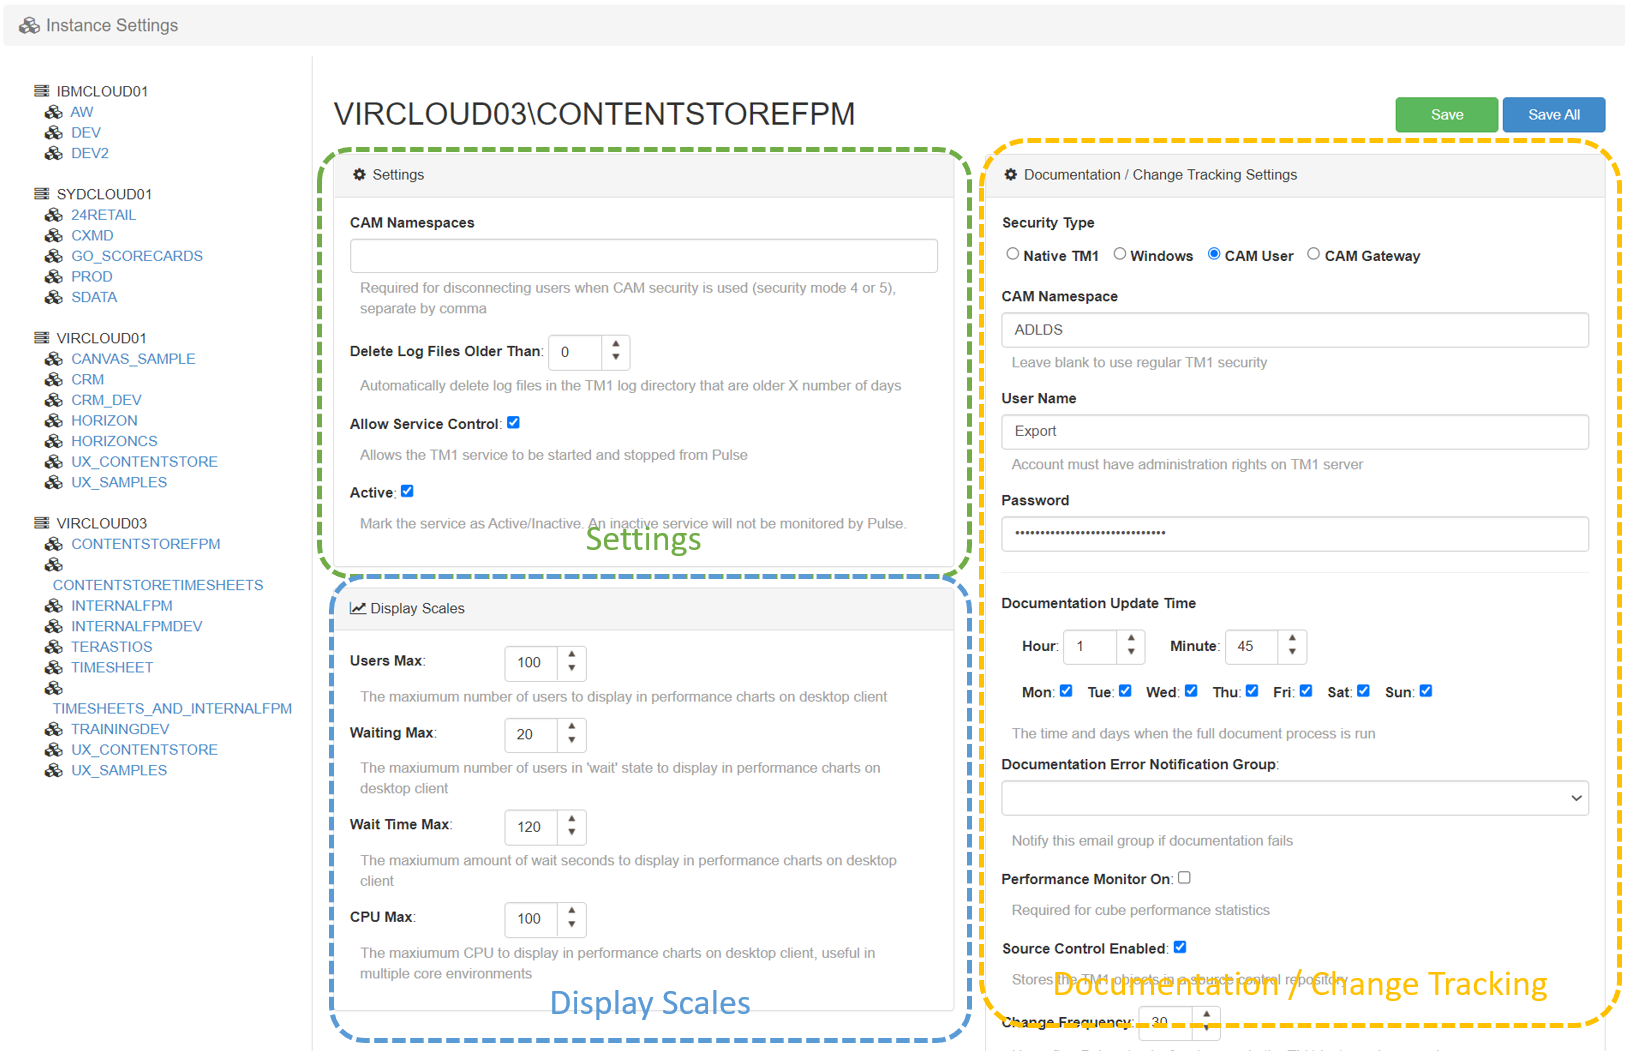
The instance settings need to be entered for each TM1 instance, the page can be split into three sections: Settings, Display Scales and Documentation / Change Tracking:
-
Pulse Configuration
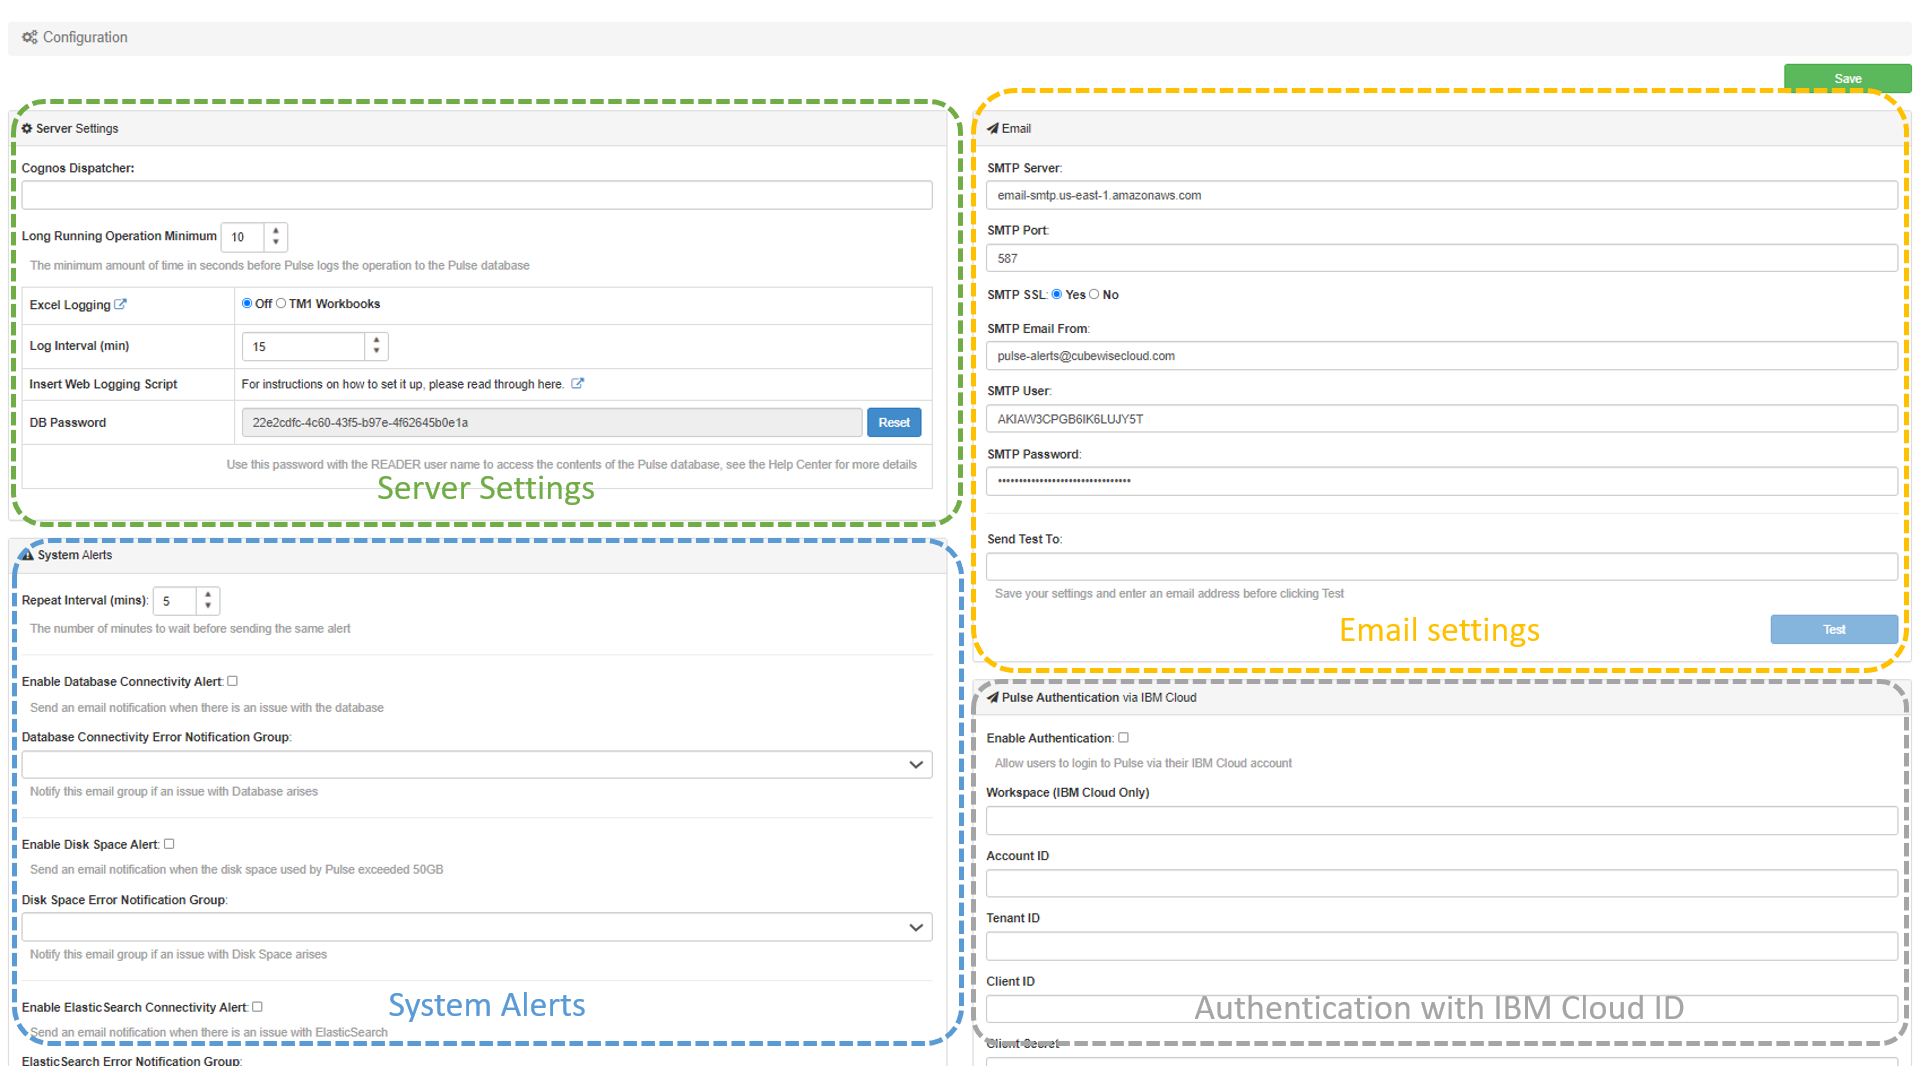
The Configuration page can be split into four sections:
-
Using the Pulse Explorer
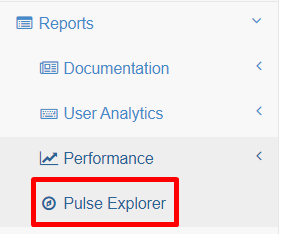
The Pulse Explorer is the best Pulse feature to troubleshoot issues that happened in the past.
-
Pulse Chore / Process History
Pulse keeps the history of all executions of the chores and processes. To see it, go to Chore / Process History and select one TM1 instance:
-
Pulse Change Tracking

Pulse includes automatic source control and change tracking as one of its core features. All changes in your IBM Planning Analytics (TM1) system can now be automatically logged to the internal Pulse source repository. These changes are identified by author, the person who made the change or executed the change via a Turbo Integrator process…
-
Pulse Model Spotlight

In Model Spotlight, you have an overview of your TM1 application:
-
Pulse Live Monitor

The Live Monitor gives you lots of information about the TM1 instance you pick